

Navigating the 2025 hurricane season: what it means for ILS investors
As the 2025 Atlantic hurricane season approaches, investors in Insurance-Linked Securities (ILS) are paying close attention to climate forecasts and reassessing portfolio risk. While ILS offer returns largely uncorrelated with wider financial markets, they are directly influenced by weather-related events, particularly hurricanes in the United States.
Understanding how evolving meteorological conditions impact expected losses and portfolio resilience is critical. With forecasts pointing to another active hurricane season - albeit less severe than 2024 - estimating the potential impact on the ILS market is not straightforward and requires sophisticated tools and models.
What is ILS and why do hurricane forecasts matter?
Insurance-Linked Securities are financial instruments - most notably catastrophe bonds (Cat Bonds) - that transfer insurance risk from insurers or reinsurers to capital markets. In return for taking on the risk of events such as hurricanes, investors receive regular coupon payments. If a qualifying event occurs, part or all of the principal may be used to pay insurance claims.
Hurricanes in the Atlantic basin, especially those that make landfall in the US, represent the most significant risk exposure for the Cat Bond market. The number and intensity of these storms, and more importantly where they strike, can greatly influence insured losses and the performance of ILS portfolios. As a result, hurricane season forecasts are one input that can be incorporated into pricing, portfolio construction, and risk modelling.
A milder season than 2024 - but still active
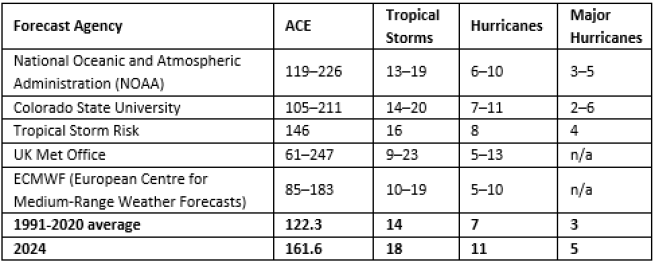
Meteorological agencies currently project that the 2025 hurricane season will be active, though not as extreme as the hyperactive season in 2024. Two main climate drivers are behind this outlook:
- Warm Atlantic Sea Surface Temperatures (SST): Warm water acts as fuel for hurricanes, enabling their formation and intensification.
- Neutral ENSO Conditions: ENSO, or the El Niño–Southern Oscillation, affects wind patterns in the Atlantic. Neutral conditions (neither El Niño nor La Niña) generally reduce wind shear, creating favourable conditions for storms to form and strengthen.
SSTs are currently tracking well above the long-term average, with only 2023 and 2024 showing warmer conditions historically. ENSO projections suggest that neutral conditions will persist through the peak hurricane months of August to October, reinforcing expectations for an above-average season.
Accumulated Cyclone Energy
One of the key metrics used to gauge seasonal hurricane activity is Accumulated Cyclone Energy (ACE). ACE accounts for both the intensity and the duration of all tropical cyclones in a season, making it a more comprehensive measure than storm count alone. It is often forecasted based on current SST and ENSO patterns.
However, ACE doesn’t tell the full story. For example, two years can have similar ACE totals but very different storm characteristics. One season may include many short-lived hurricanes, while another may be marked by fewer but longer-lasting and more intense storms. This highlights the random nature of hurricane formation, which adds complexity to forecasting and risk management.
Why forecasts alone aren’t enough
While these forecasts suggest higher-than-average activity, it’s important to remember that total damage depends more on where hurricanes make landfall - and their strength at that point - than how many form.
The 2024 hurricane season illustrates this point well. While it featured 11 hurricanes, only two (Helene and Milton) made major landfall in the US, resulting in less than $40 billion in insured losses - well below initial projections.
In fact, historical data shows a weak correlation between the number of hurricanes and the level of insured losses. A single powerful landfalling storm in a high-density area can cause more damage than a dozen weaker ones that remain offshore.
Modelling the risk
Given this uncertainty, we rely on catastrophe models based on Monte Carlo simulations. These simulate hundreds of thousands of possible hurricane seasons, varying the frequency, strength, path, and landfall location of storms to estimate likely outcomes.
We use adjusted models based on Verisk’s AIR Worldwide platform to account for current climate signals. This helps refine key risk metrics such as:
- Expected Loss (EL): The average annual loss, expressed as a percentage, an investor might incur on an ILS instrument.
- Excess spread: The difference between the discount margin (or spread) and the expected loss.
- Value-at-Risk (VaR): The estimated maximum loss over a given time frame, at a specified confidence level.
What does it mean for investors?
Using updated 2025 hurricane forecasts, our models show only a modest increase in Expected Loss - about 15% higher than the base case. Yet yields remain compelling:
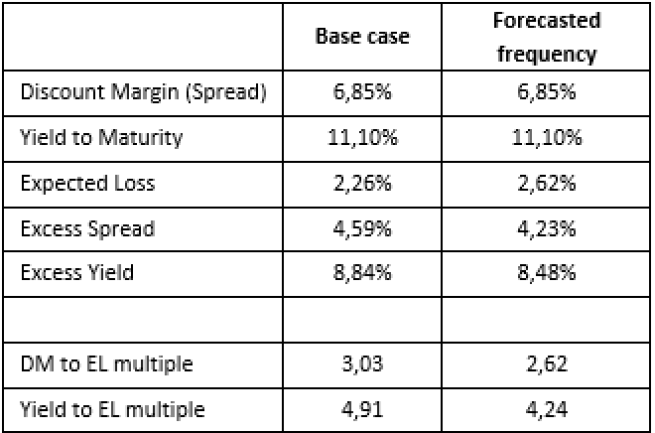
These figures indicate that investors are still being well compensated for the variability in the US hurricane risk, with the yield to EL multiple higher than 4x.
Managing risk through portfolio design
A robust ILS strategy requires resilience to variability in the underlying risks. We build portfolios designed to weather a range of scenarios:
- Diversification by peril and region: We avoid overconcentration in hurricane-prone areas like the US Southeast and maintain exposure to other perils such as European windstorms or Japanese earthquakes.
- Systematic stress testing: Every asset is analysed for sensitivity to changes in frequency and severity. If the expected return doesn’t sufficiently offset the risk, we exclude it.
- Proprietary risk views: We regularly review and adjust vendor models to reflect our in-house views on climate trends, insurance market dynamics, and historical loss data.
Attractive risk-adjusted returns still in sight
While the 2025 Atlantic hurricane season is shaping up to be more active than average, the fundamentals of the ILS market remain strong. Our forecasts shows that investors are well compensated for each unit of expected risk. Thanks to careful modeling, broad diversification, and disciplined portfolio construction, investors can access attractive returns - without taking undue risk.
As climate volatility becomes more rooted, the ILS asset class continues to stand out. It offers an appealing combination of yield, diversification, and low correlation to traditional markets - making it a compelling opportunity for those prepared to manage its unique risks.
[1] These scenarios are presented as of the publication date. They do not constitute a representation or guarantee as to future scenarios nor performances. AXA IM disclaims any and all liability relating to these scenarios’ description and can modify these scenarios according to market evolutions and taking into account the regulations in force.
Not for Retail distribution: This marketing communication is intended exclusively for Professional, Institutional or Wholesale Clients / Investors only, as defined by applicable local laws and regulation. Circulation must be restricted accordingly.
This document is for informational purposes only and does not constitute investment research or financial analysis relating to transactions in financial instruments as per MIF Directive (2014/65/EU), nor does it constitute on the part of AXA Investment Managers or its affiliated companies an offer to buy or sell any investments, products or services, and should not be considered as solicitation or investment, legal or tax advice, a recommendation for an investment strategy or a personalized recommendation to buy or sell securities.
It has been established on the basis of data, projections, forecasts, anticipations and hypothesis which are subjective. Its analysis and conclusions are the expression of an opinion, based on available data at a specific date.
All information in this document is established on data made public by official providers of economic and market statistics. AXA Investment Managers disclaims any and all liability relating to a decision based on or for reliance on this document. All exhibits included in this document, unless stated otherwise, are as of the publication date of this document.
Furthermore, due to the subjective nature of these opinions and analysis, these data, projections, forecasts, anticipations, hypothesis, etc. are not necessary used or followed by AXA IM’s portfolio management teams or its affiliates, who may act based on their own opinions. Any reproduction of this information, in whole or in part is, unless otherwise authorised by AXA IM, prohibited.
Issued by AXA INVESTMENT MANAGERS PARIS, a company incorporated under the laws of France, having its registered office located at Tour Majunga, 6 place de la Pyramide, 92800 Puteaux, registered with the Nanterre Trade and Companies Register under number 353 534 506, and a Portfolio Management Company, holder of AMF approval no. GP 92-08, issued on 7 April 1992.
In other jurisdictions, this document is issued by AXA Investment Managers SA’s affiliates in those countries.
AXA IM and BNPP AM are progressively merging
AXA IM and BNPP AM are progressively merging and streamlining our legal entities to create a unified structure
AXA Investment Managers joined BNP Paribas Group in July 2025. Following the merger of AXA Investment Managers Paris and BNP PARIBAS ASSET MANAGEMENT Europe and their respective holding companies on December 31, 2025, the combined company now operates under the BNP PARIBAS ASSET MANAGEMENT Europe name.