

Climate Change and ILS: Boon or Bane?
- The number of natural catastrophes is increasing, and some of them are growing in intensity too. This is contributing to an increased need for insurance.
- The Insurance-Linked Securities (ILS) asset class has grown steadily over the last decade as insurers turn to capital markets to cover weather-related losses.
- More investors are discovering the unique diversification potential of ILS, in addition to the attractive return premium and limited volatility, as ILS have little to no correlation with economic cycles.
Climate change is leading to more (and costlier) natural catastrophes
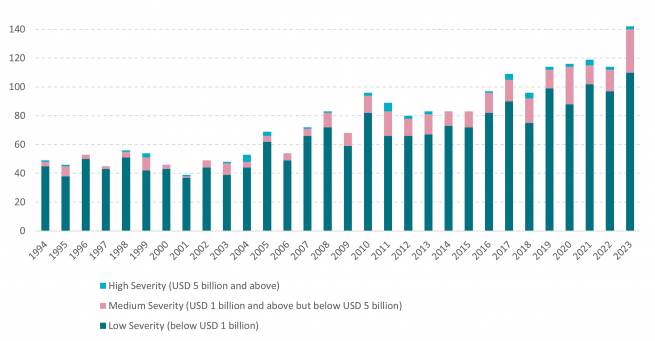
The globe is warming faster than at any rate seen over the last 10,000 years[1]. With climate change comes an increasing frequency and intensity of floods and wildfires, and an increase in the intensity of tropical storms and hurricanes, while there is no increase in the frequency of the two latter. Since 1994, the number of medium-sized events (with damages between $1bn - $5bn) has grown by an average 7.5% year-on-year[2].
An increased number of natural catastrophes is driving demand for insurance. To better protect themselves and offload some of their risk, insurance companies can turn to either re-insurers or investors, through Insurance-Linked Securities (ILS).
How ILS work
Insurance companies use ILS to transfer the risk of specific events, often nature-related, to capital markets. ILS co-exist with reinsurance markets, and they are complementary rather than competing. Key differences include that insurers use ILS to access a broader pool of capital, often at a higher cost than traditional reinsurance, and different tenures - reinsurance contracts typically cover one year, while ILS is spread over a longer period, often around three years. A large part of the ILS market is made up of catastrophe bonds (Cat bonds), which mainly cover natural disasters.
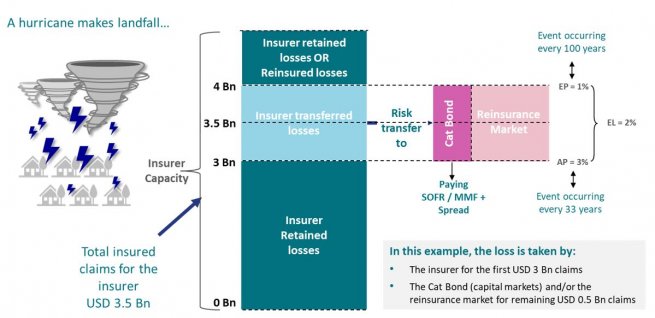
In the example below, an insurer would pay out the initial three billion of insured claims in the event of a hurricane, while half a billion would be paid by ILS investors and reinsurers. If no event occurs during the defined time, investors have received a return comprised of the floating rate plus a spread, depending on the probability that the hurricane causes significant damage.
Selectivity is key
There are both positive supply and demand factors for ILS – insurers need to cover costlier climate-related events, and more investors are discovering the attractive diversification benefits. Because of this, the market continues to expand, covering more perils and regions. This means better opportunities for ILS managers to be more selective and increase the diversification. It is important to highlight that ILS portfolios are actively managed, it is not a beta exposure to catastrophe risk. For example, our selection process means we had relatively low exposure to the most detrimental events of the most recent hurricane season and we continue to be underexposed in areas that are most prone to these type of natural catastrophes.
Insured losses are increasing – but climate change is only part of the explanation
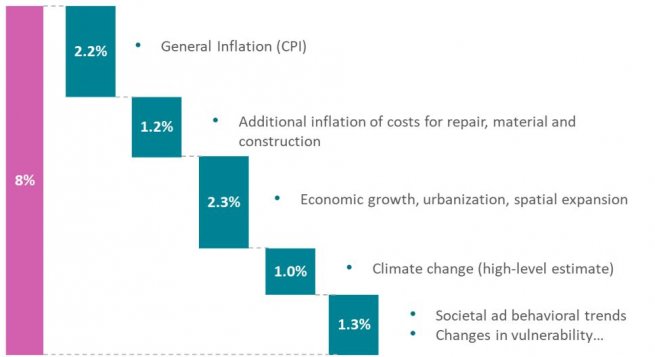
While climate change is driving an increased demand for climate-related insurance, and higher total losses, it is only part of the explanation. As the chart below shows (for convective storms in the US), nearly half of the increase in total losses over the past 15 years has been down to inflation – a factor that will have accelerated rapidly in recent years. Our changed ways of living are another major driver, with for example more concentrated populations due to urbanisation and population growth. Swiss Re estimates that out of the total 8% annual increase in losses from 2008 – 2023, only 1 percentage point is related to climate change.
The protection gap remains wide
While the volume of insured losses globally is rising, a wide protection gap remains. This is partially due to a lack of capital in emerging markets where many individuals and companies are under-insured. There are protection gaps as well in developed countries. This emphasises the need for active management when investing in ILS, where allocators need to have a deep understanding of the impact of natural catastrophes, know in detail which perils the insurance covers, and focus on quality.
The investment case
Alternative capital has grown steadily as a source for insurers over the last decade, with an annual growth rate of around 4.5%[3]. More and more institutional investors realise the benefits ILS can add to a portfolio:
- By insuring against natural events rather than economic, ILS have little to no correlation with economic cycles. Apart from the floating rate factor, ILS should for example not be impacted by a market crash. In an institutional portfolio this provides excellent diversification benefits.
- ILS also offer attractive risk premiums. Relative to its Expected Loss (EL), spreads for a Cat Bond covering the risk of a hurricane, which has historically occurred every 50 years, (2% EL) are typically around 7.5%[4] - a multiple of nearly four times the expected loss. 2023 was a very good year for ILS investors, we except returns to be slightly less remarkable in 2024.
- Limited volatility compared to traditional asset classes. Although, like many alternative asset classes it has limited liquidity.
A growing market
More insurers are turning to capital markets to re-insure part of their exposure, which is positive for ILS investors as more perils and geographies are covered, and they can be more selective. On the other hand, insured losses are rising. Climate change is however only partially responsible for this, with inflation and population growth having a much bigger impact.
We see continued growth for the market, as it continues to deliver highly attractive returns. But selectively, and a deep understanding of climate related risks, is key to avoid parts of the market where climate change will have a significantly negative impact.
[1] NASA Climate change report. July 2024.
[2] Source: Swiss Re and AXA IM, January 2024.
[3] Source: AXA IM Alts. Based on Guy Carpenter, A.M. Best. Dec 2023.
[4] Source: AXA IM Alts. July 2024. For illustrative purposes only.
EL = Expected Loss, average loss over all scenarios, expressed as a percentage of the principal amount. AP = Attachment Probability, probability of exceeding the ILS trigger level which would cause the first-dollar loss to the ILS. EP = Exhaustion Probability, probability of 100% loss to the ILS.
Disclaimer
Not for Retail distribution: This marketing communication is intended exclusively for Professional, Institutional or Wholesale Clients / Investors only, as defined by applicable local laws and regulation. Circulation must be restricted accordingly.
This document is for informational purposes only and does not constitute investment research or financial analysis relating to transactions in financial instruments as per MIF Directive (2014/65/EU), nor does it constitute on the part of AXA Investment Managers or its affiliated companies an offer to buy or sell any investments, products or services, and should not be considered as solicitation or investment, legal or tax advice, a recommendation for an investment strategy or a personalized recommendation to buy or sell securities.
It has been established on the basis of data, projections, forecasts, anticipations and hypothesis which are subjective. Its analysis and conclusions are the expression of an opinion, based on available data at a specific date.
All information in this document is established on data made public by official providers of economic and market statistics. AXA Investment Managers disclaims any and all liability relating to a decision based on or for reliance on this document. All exhibits included in this document, unless stated otherwise, are as of the publication date of this document.
Furthermore, due to the subjective nature of these opinions and analysis, these data, projections, forecasts, anticipations, hypothesis, etc. are not necessary used or followed by AXA IM’s portfolio management teams or its affiliates, who may act based on their own opinions. Any reproduction of this information, in whole or in part is, unless otherwise authorised by AXA IM, prohibited.
Issued by AXA INVESTMENT MANAGERS PARIS, a company incorporated under the laws of France, having its registered office located at Tour Majunga, 6 place de la Pyramide, 92800 Puteaux, registered with the Nanterre Trade and Companies Register under number 353 534 506, and a Portfolio Management Company, holder of AMF approval no. GP 92-08, issued on 7 April 1992.
In other jurisdictions, this document is issued by AXA Investment Managers SA’s affiliates in those countries.
AXA IM and BNPP AM are progressively merging
AXA IM and BNPP AM are progressively merging and streamlining our legal entities to create a unified structure
AXA Investment Managers joined BNP Paribas Group in July 2025. Following the merger of AXA Investment Managers Paris and BNP PARIBAS ASSET MANAGEMENT Europe and their respective holding companies on December 31, 2025, the combined company now operates under the BNP PARIBAS ASSET MANAGEMENT Europe name.